

Photo by Sarah Agnew on Unsplash
James Meadway
Kemi Badenoch's welfare plan would push around 1.8 million more people in Britain below the poverty line, including 850,000 children. This estimate for 2029-30 excludes those hardest hit of all: the foreign nationals who would lose every working-age benefit. The Child Poverty Action Group has already warned of the “biggest overnight increase in child poverty since records began”. Verdant’s numbers confirm the case.
What is in the plan
The Conservatives set out their plans in Welfare that Works, a 52-page document that details how they intend to cut £36 billion a year from the benefits bill. The plan includes costings, which allows us to simulate their impacts. The headlines are:
No PIP or Universal Credit health element for “mild” mental health conditions or routine back and joint pain: £14.1bn (£13.7bn after £1bn put back into support).
Ending benefits for foreign nationals without EU settled status: £9.5bn.
Local Housing Allowance cut to the 10th percentile of rents, and a five-year social rent freeze: £4.5bn.
The two-child limit restored: £3.1bn. Child DLA for ADHD, learning difficulties and behavioural disorders limited to the most severe cases: £3.8bn including passported benefits.
A tighter benefit cap, no VAT relief on unadapted Motability cars and a fraud crackdown, £1bn each; a “Subsistence Allowance” at 70% of the UC standard allowance for the long-term unemployed, £0.5bn.
Who loses
Details of the modelling are at the end of this blog, but we use a combination of the PolicyEngine microsimulation model and the ONS’ Family Resources Survey to understand who is in different households across Britain, and then calculate the impact on each from the welfare policy changes. The Family Resources Survey has no nationality data, so the foreign nationals cut is treated separately at the end, with more of a rough estimate as to its likely impacts.
Some 91% of the £23bn loss we can simulate falls on the 5.6 million households where someone receives PIP or DLA. They lose £3,690 a year, 7.6% of their income.
Losses on that scale push people under the poverty line. Today 14.1 million people in Britain live below 60% of median income after housing costs, the official measure of poverty. The plan adds about 1.8 million, including 850,000 children, taking child poverty up by a fifth in one policy change. Some 1.5 million of those who would be pushed into poverty are in a household with at least one person with a disability. The huge increase in poverty assumes the Conservatives' cost cuttings are actually delivered, but this is (perhaps thankfully) not guaranteed. The IFS points out that neither PIP nor the UC health element is assessed by condition, so cutting by diagnosis “could well save less than expected”.
The graph below shows the impact across households in different parts of the income distribution, from the poorest 10% to the richest.
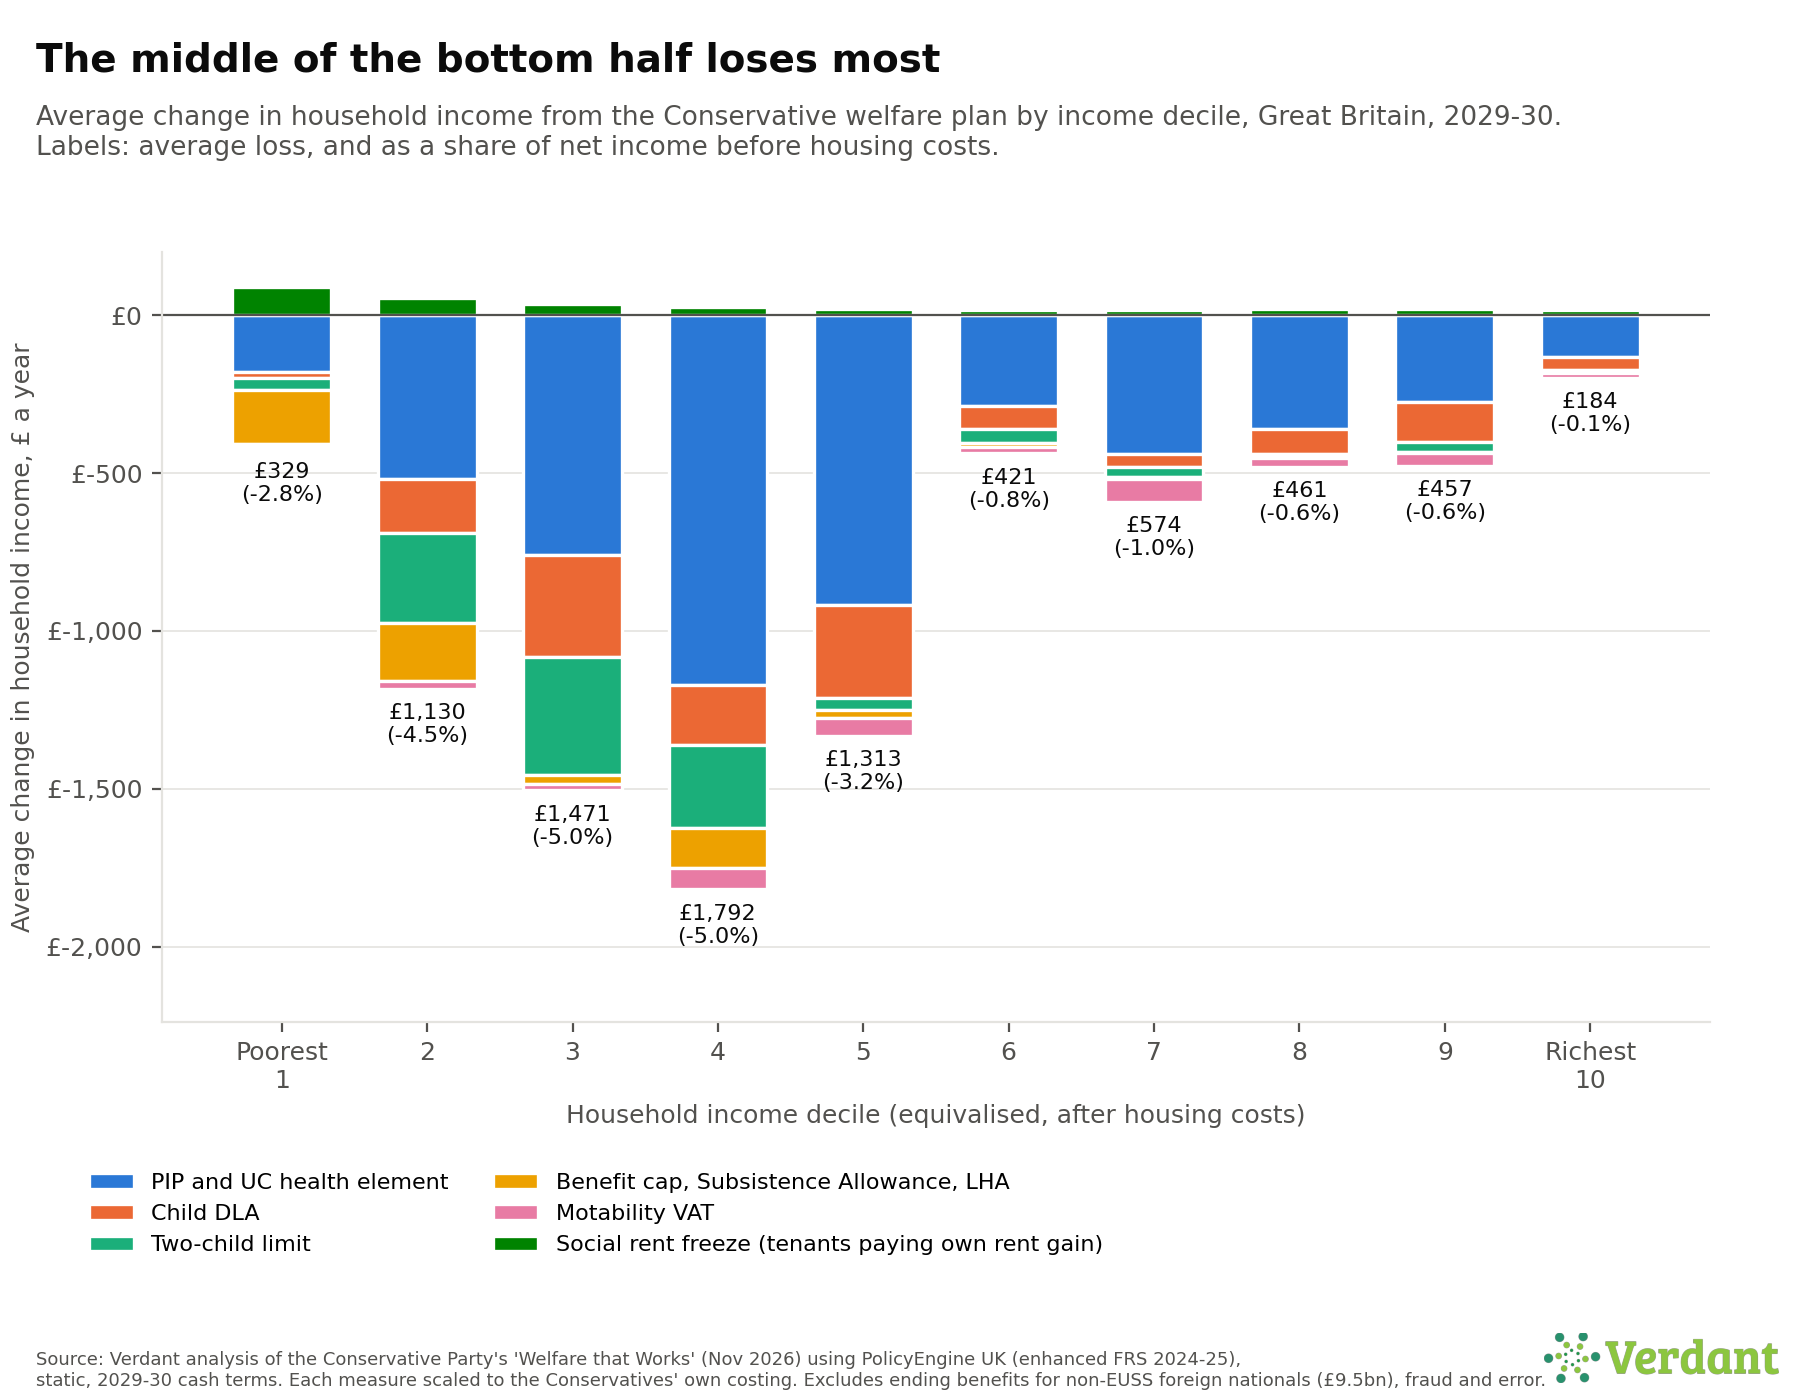
It is, predictably, the poorest who lose most. Those in poorest 20% to the poorest 40% lose £1,130 to £1,790 a year, around 5% of income, but the richest tenth lose only £180. The very poorest 10% loses less from these cuts because disability benefits actually lift many recipients out of it – but that means cutting those benefits would push many right back into the worst poverty.
The next graph shows how different kinds of households, with different people in them, are likely to be affected.
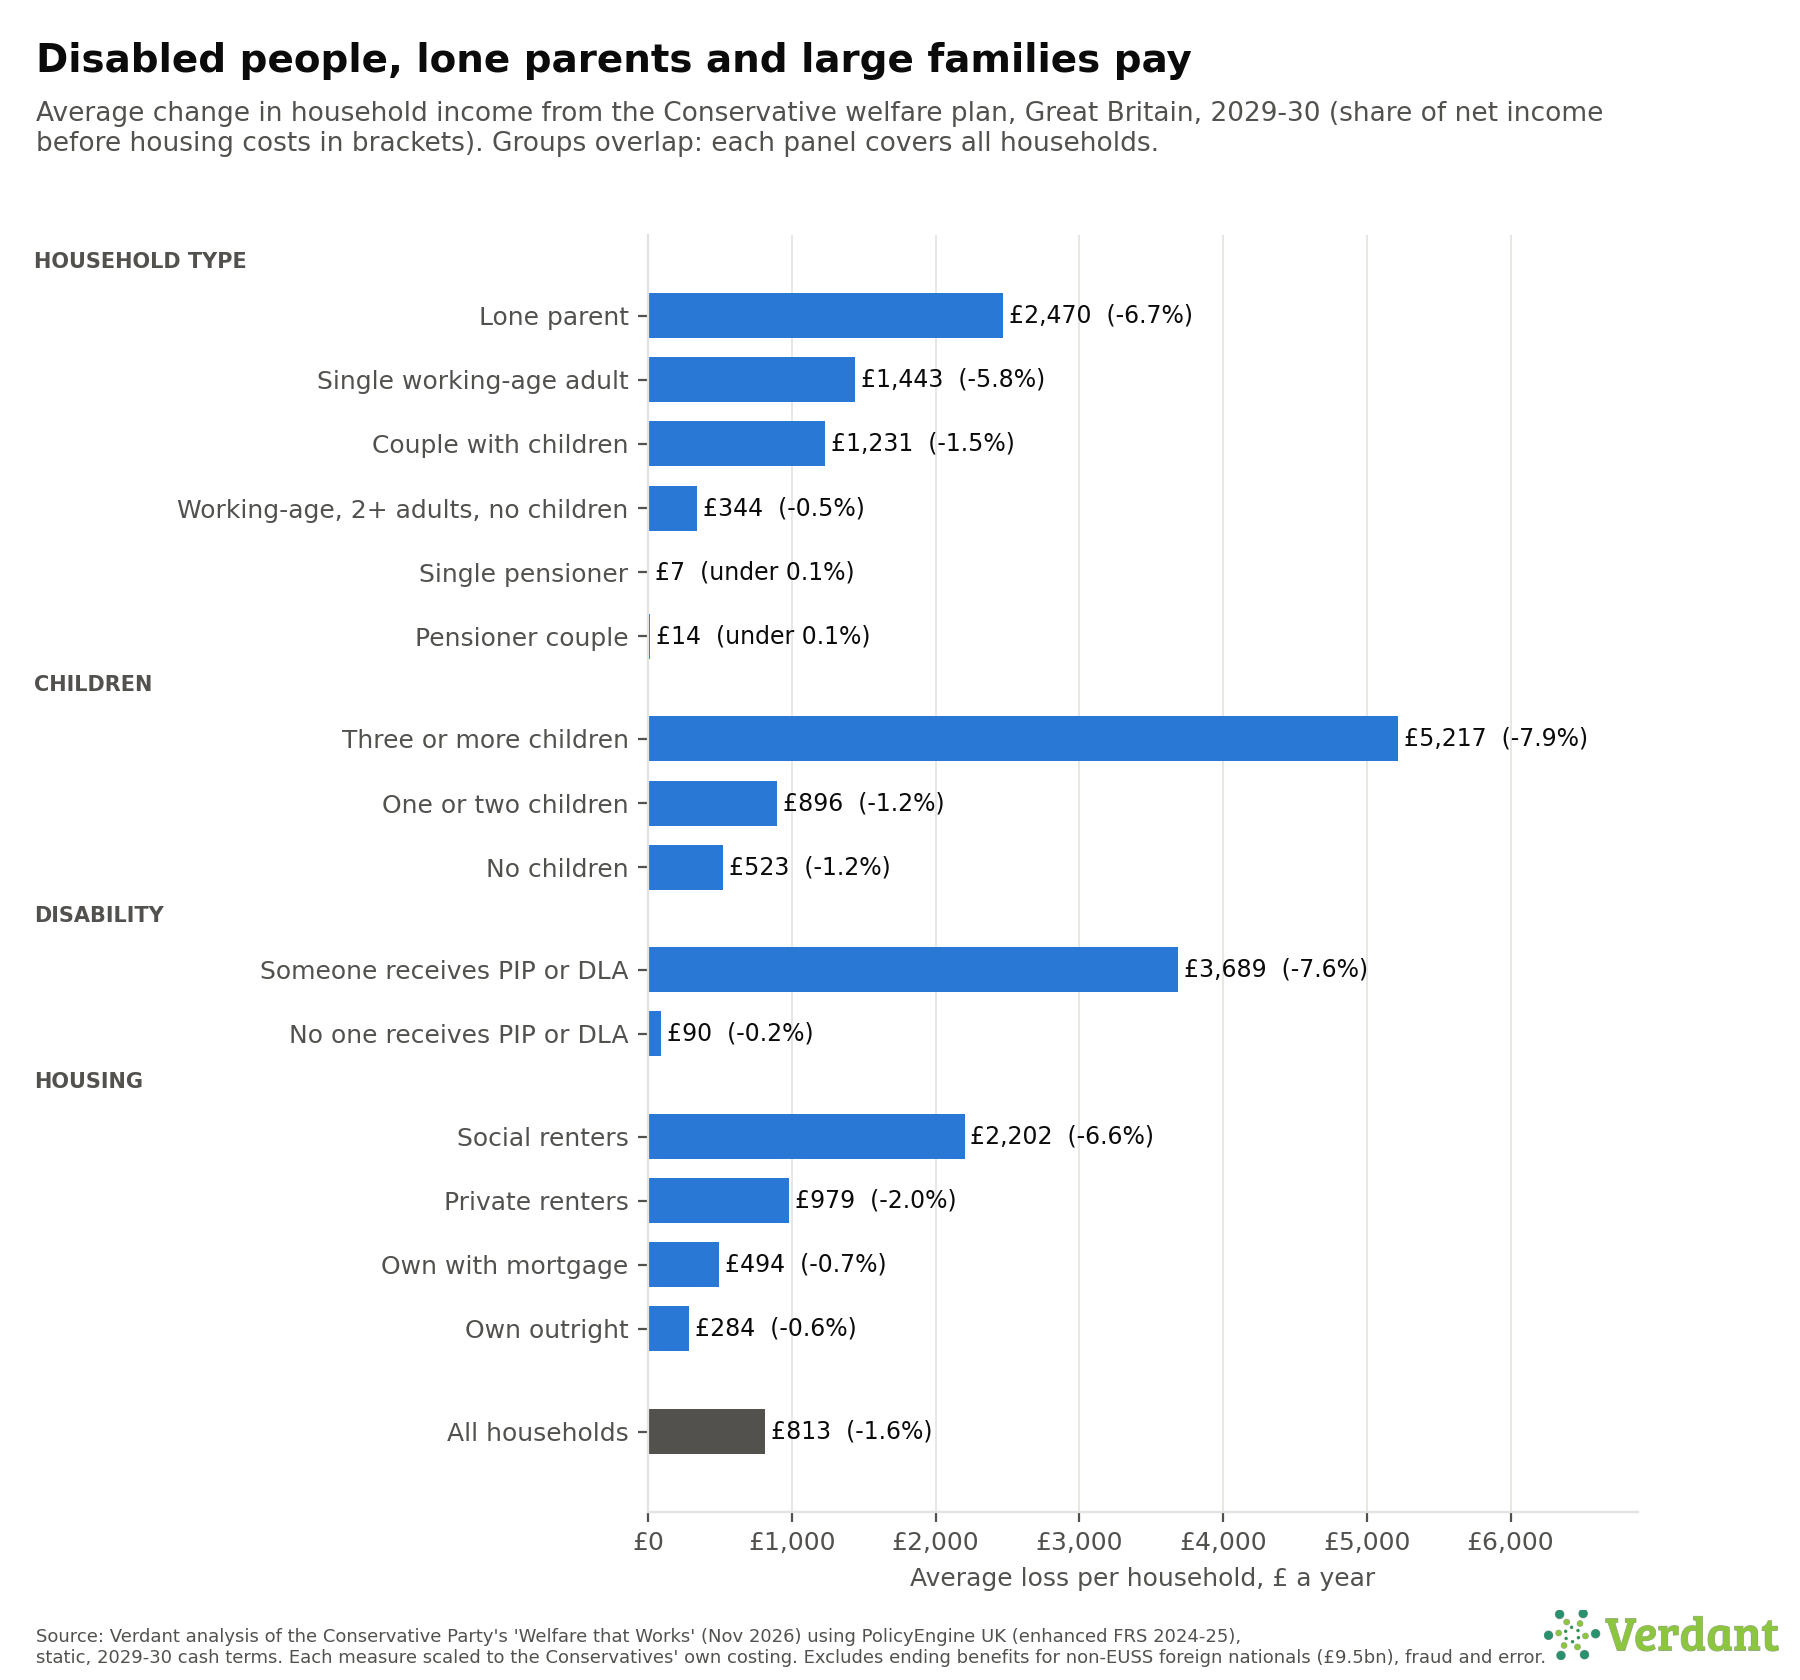
Families with three or more children lose on average £5,220 a year, 7.9% of income, as the two-child limit, the child DLA cut and the tighter household benefit cap land together. Lone parents lose £2,470, social renters £2,200. Pensioners lose almost nothing. The child DLA cut takes £3.8bn a year from families with a disabled child.
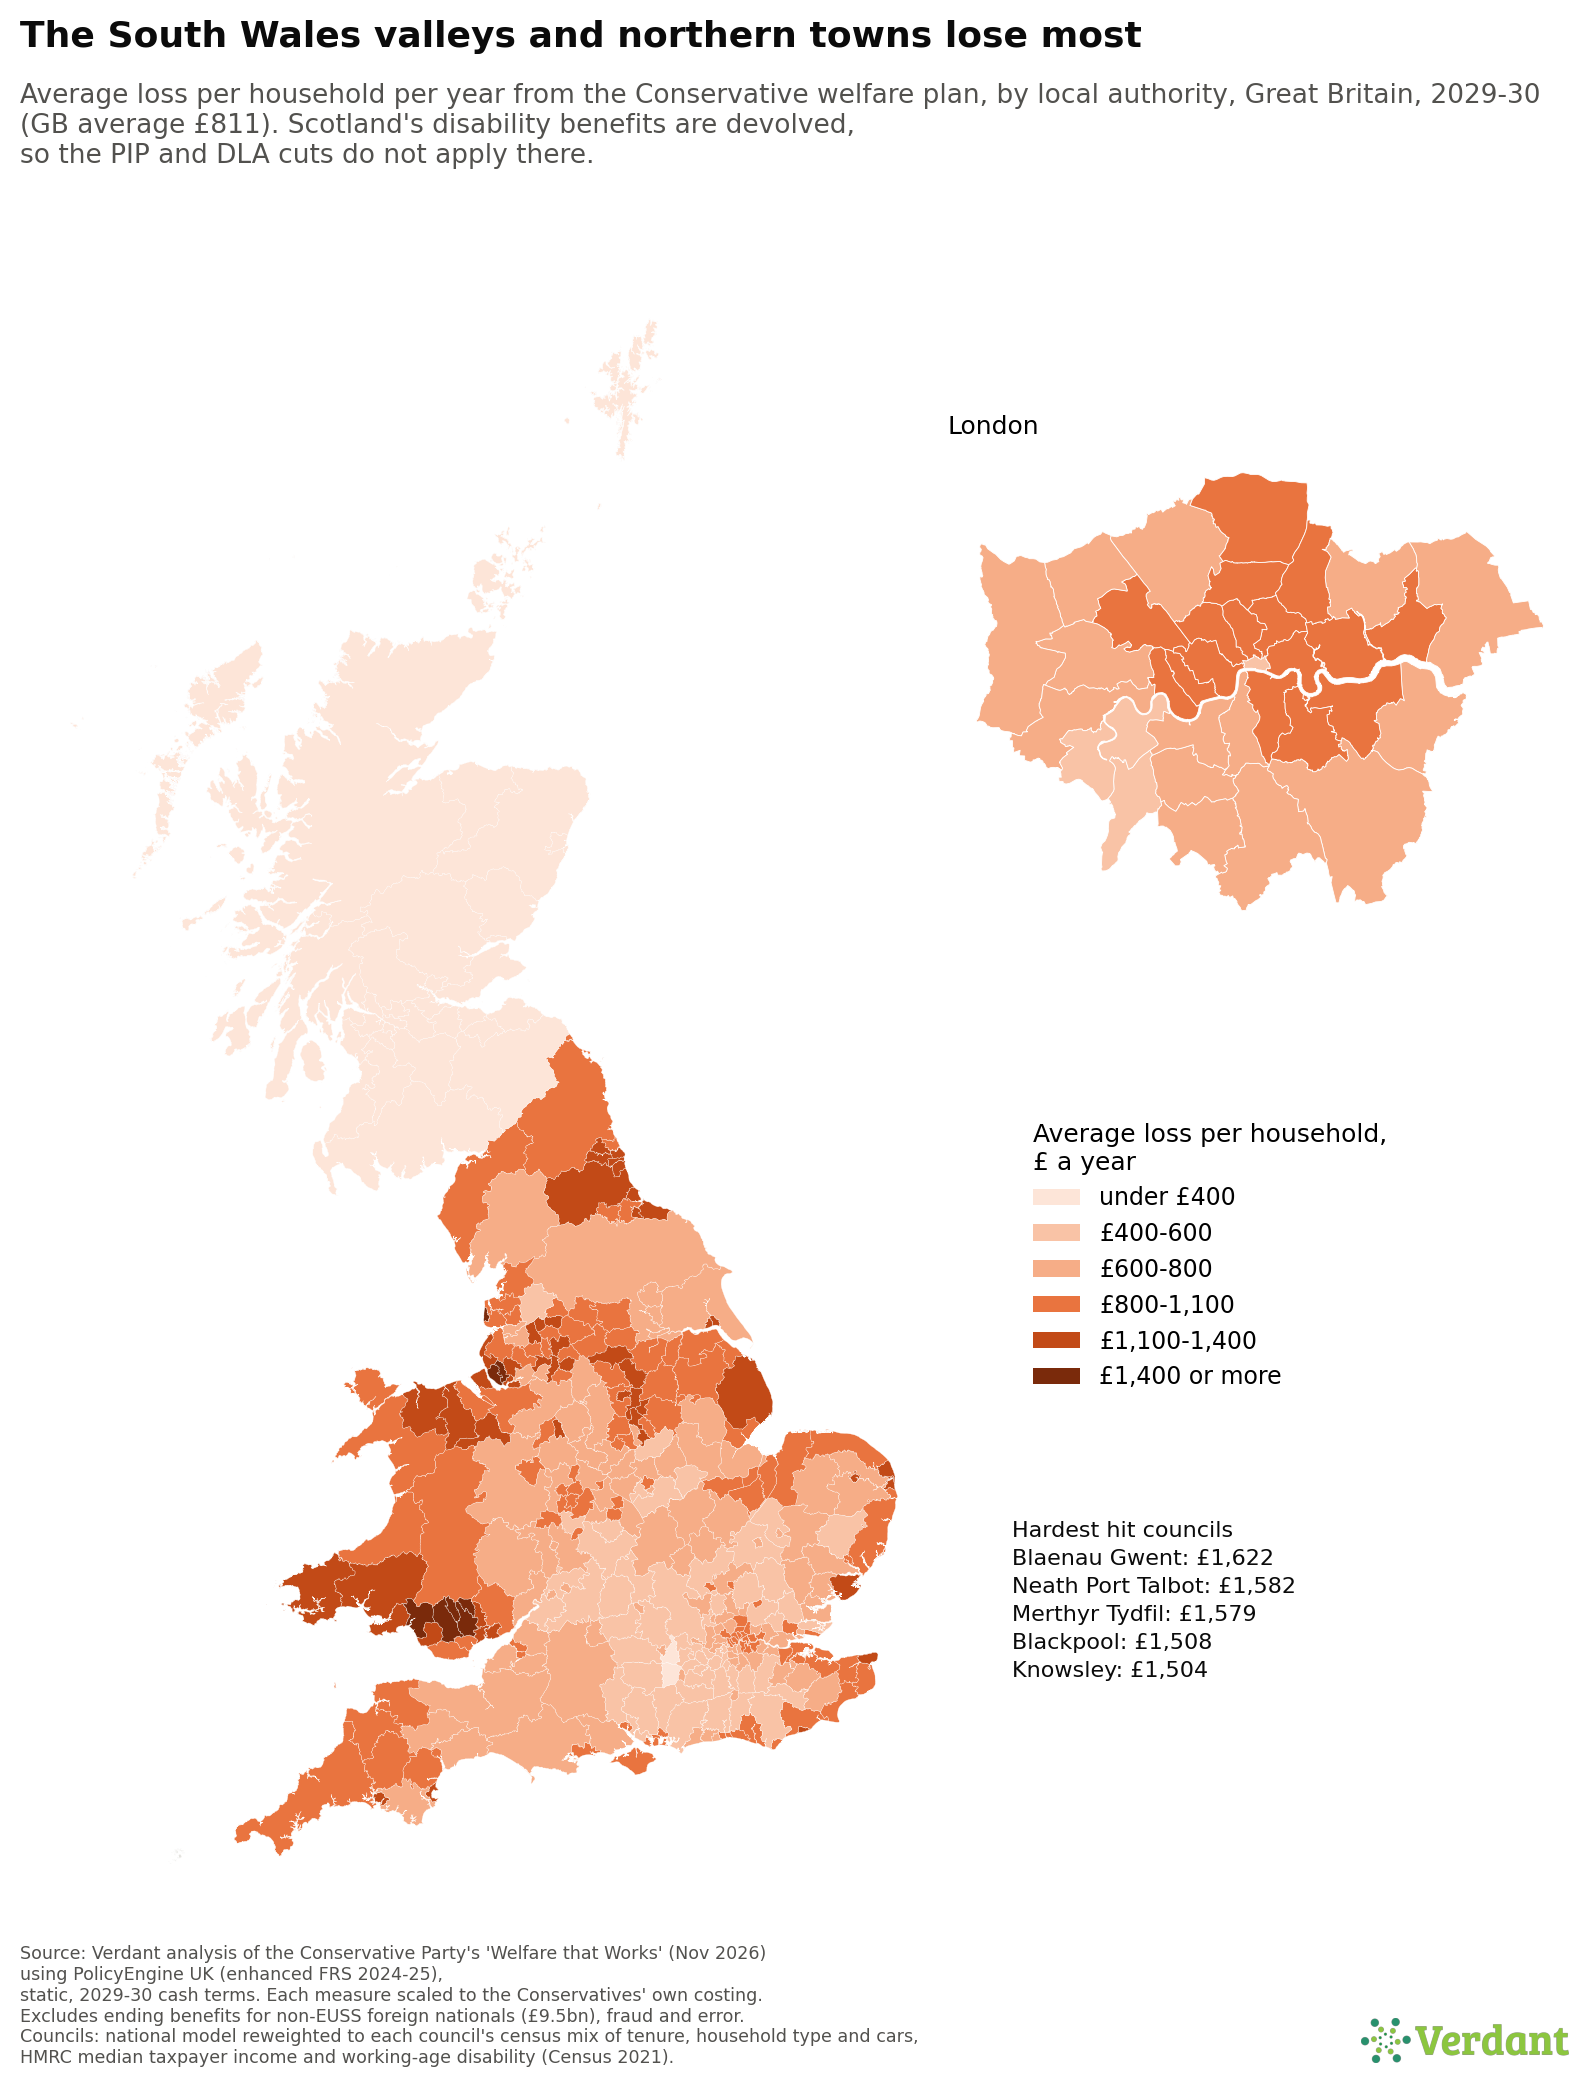
Wales loses £1,220 per household, Blaenau Gwent £1,620. In England the worst hit are Blackpool and Knowsley (about £1,500), and Liverpool, Hartlepool and Sunderland (about £1,360 to £1,460); Wokingham and Hart lose about £390. Scotland (on this modelling) loses only £240 per household because its disability benefits are devolved. This means the map probably understates the likely loss.
Excluding housing benefit changes
Local Housing Allowance is frozen at rates based on September 2023 rents (SI 2026/5). The saving the plan claims depends on what it is measured against. By 2029, on our forecasts, the currently-frozen rates sit below the 10th percentile of rents in most areas, so re-pegging as the plan describes would raise LHA for around 1.5 million households and cost about £1.3bn. A saving appears only if LHA had first been reset to the 30th percentile of current rents at the end of this Parliament, something no government has committed to. Even then, our model finds about £1bn of savings, not £1.8bn, and less once existing tenants keep their higher rates, as the plan promises. As a result, we have not counted the LHA cuts in our overall figures.
Meanwhile, the social rent freeze cuts payments to councils and housing associations, who would lose about £3.4bn a year in rent that would otherwise pay for repairs and new homes.
The £9.5bn from foreign nationals
The plan's second-biggest saving ends all working-age benefits for anyone who isn't a UK or Irish citizen and lacks EU settled status. DWP's own figures show who that is: 526,000 people on Universal Credit in May 2026, including 233,000 with indefinite leave to remain (usually after at least five years here), 131,000 refugees, and 52,000 on the Ukrainian and Afghan schemes. Nearly four in ten of them are in work. The IFS notes that many with indefinite leave could apply for citizenship and keep their benefits, so the saving is highly uncertain.
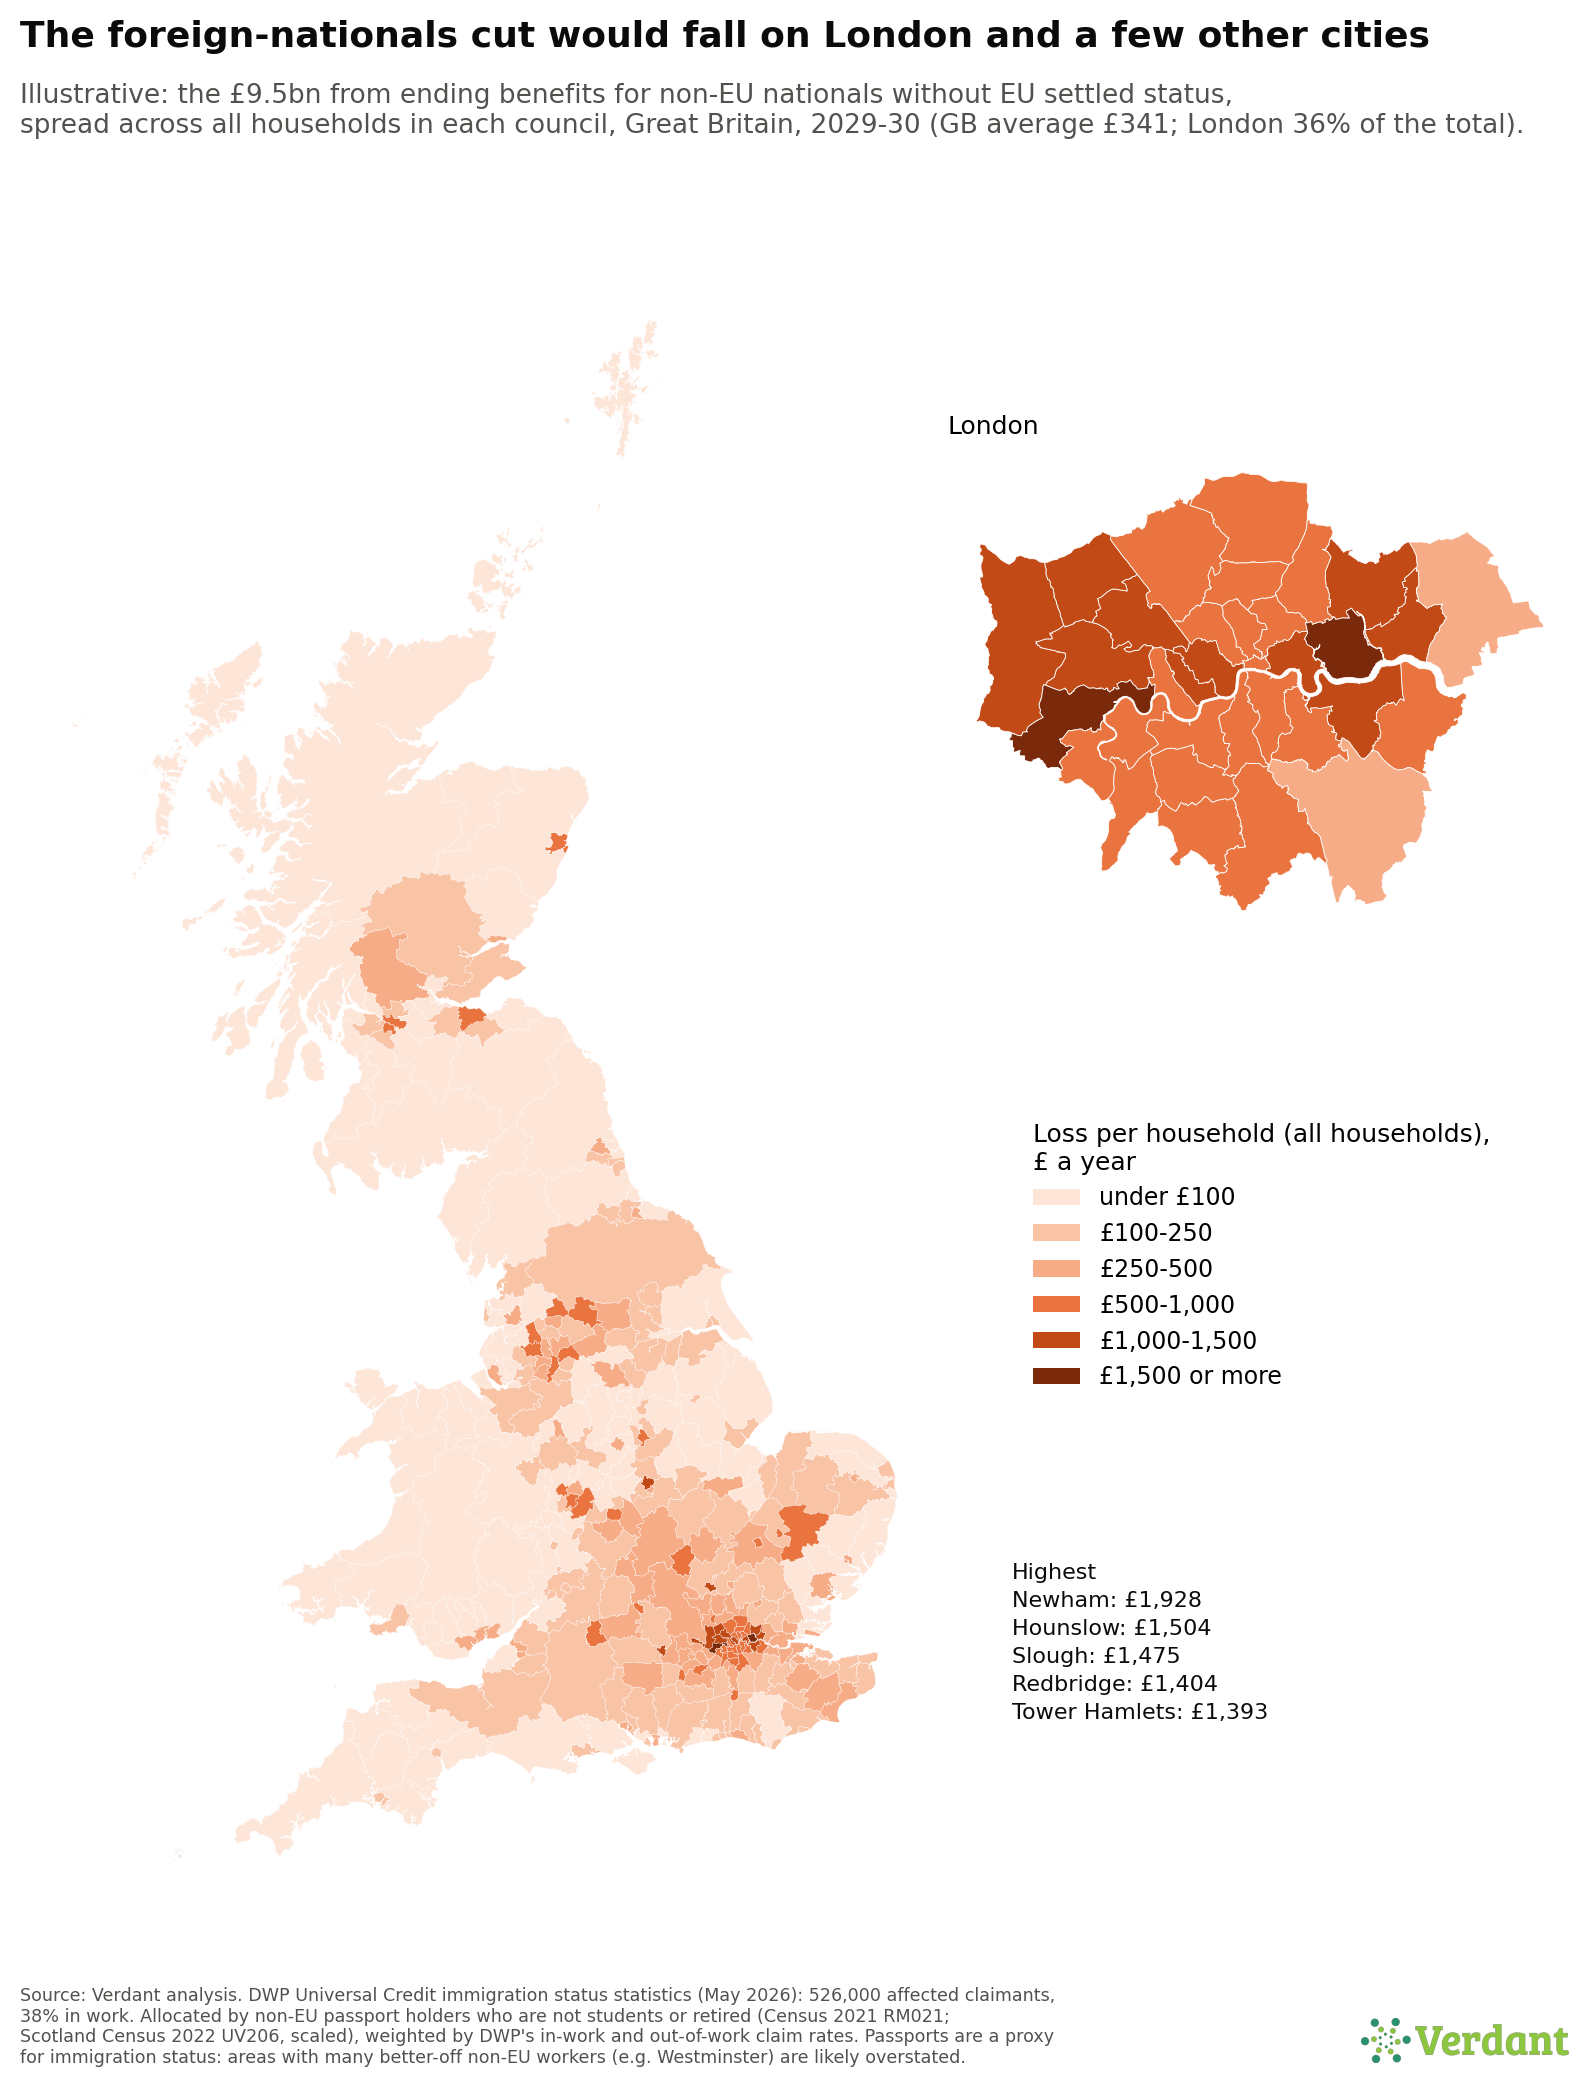
Even after the Conservatives' assumed 75% fall in refugee claims, that is around £24,000 a year for each claimant, the biggest losses in the plan. This would, on paper, cut Child Benefit for children who may be British, and contributory benefits people have paid National Insurance for. Most of these households would fall into poverty, on top of the 1.8 million. We illustrate the likely geographical impact of this on the map below, using Census passport evidence as a proxy for foreign national residents.
Spread by where non-EU nationals of working age live, 36% of the loss falls in London. Newham loses the equivalent of £1,930 for every household in the borough; Hounslow, Slough and Redbridge around £1,400 to £1,500. The map is illustrative: Census passport data stand in for immigration status.
Methods: PolicyEngine UK (modified by Family Resources Survey 2024-25, calibrated to the OBR's March 2026 forecast) with Verdant's corrections for the benefit cap, two-child limit and UC health element; 2029-30 cash terms; incomes after housing costs. Who is affected is set by the plan's stated rules; each measure is then scaled to the Conservatives' own 2029-30 costing (the model holds disability caseloads at today's level while the costings assume that they grow, and its UC health element is narrower, so PIP and UC health losses are scaled upwards to allow for this). Council figures reweight the national model to each council's census mix, HMRC incomes and working-age disability rate; they track local deprivation but are not local caseload counts.
The foreign-nationals map spreads £9.5bn by Census 2021-22 non-EU passport holders who are not students or retired, weighted by DWP's in-work and out-of-work claim rates for the affected groups (Great Britain only). Poverty: Households Below Average Income e after housing costs, line fixed at the pre-plan median; cuts fall on households drawn by the plan's rules, averaged over 60 draws, with the share affected scaled to the costings. As in official statistics, PIP and DLA count as income. Our model finds the two-child limit puts 420,000 children in poverty, close to the government's 450,000.